Customer analyticsyour users will actually use.
Connect to your data sources or push via REST API. Build fully customisable dashboards with a visual editor. Embed analytics anywhere in your app in minutes.
14-day free trial · No credit card required
Up and running in four steps.
From raw data to customer-facing dashboards in under an hour.
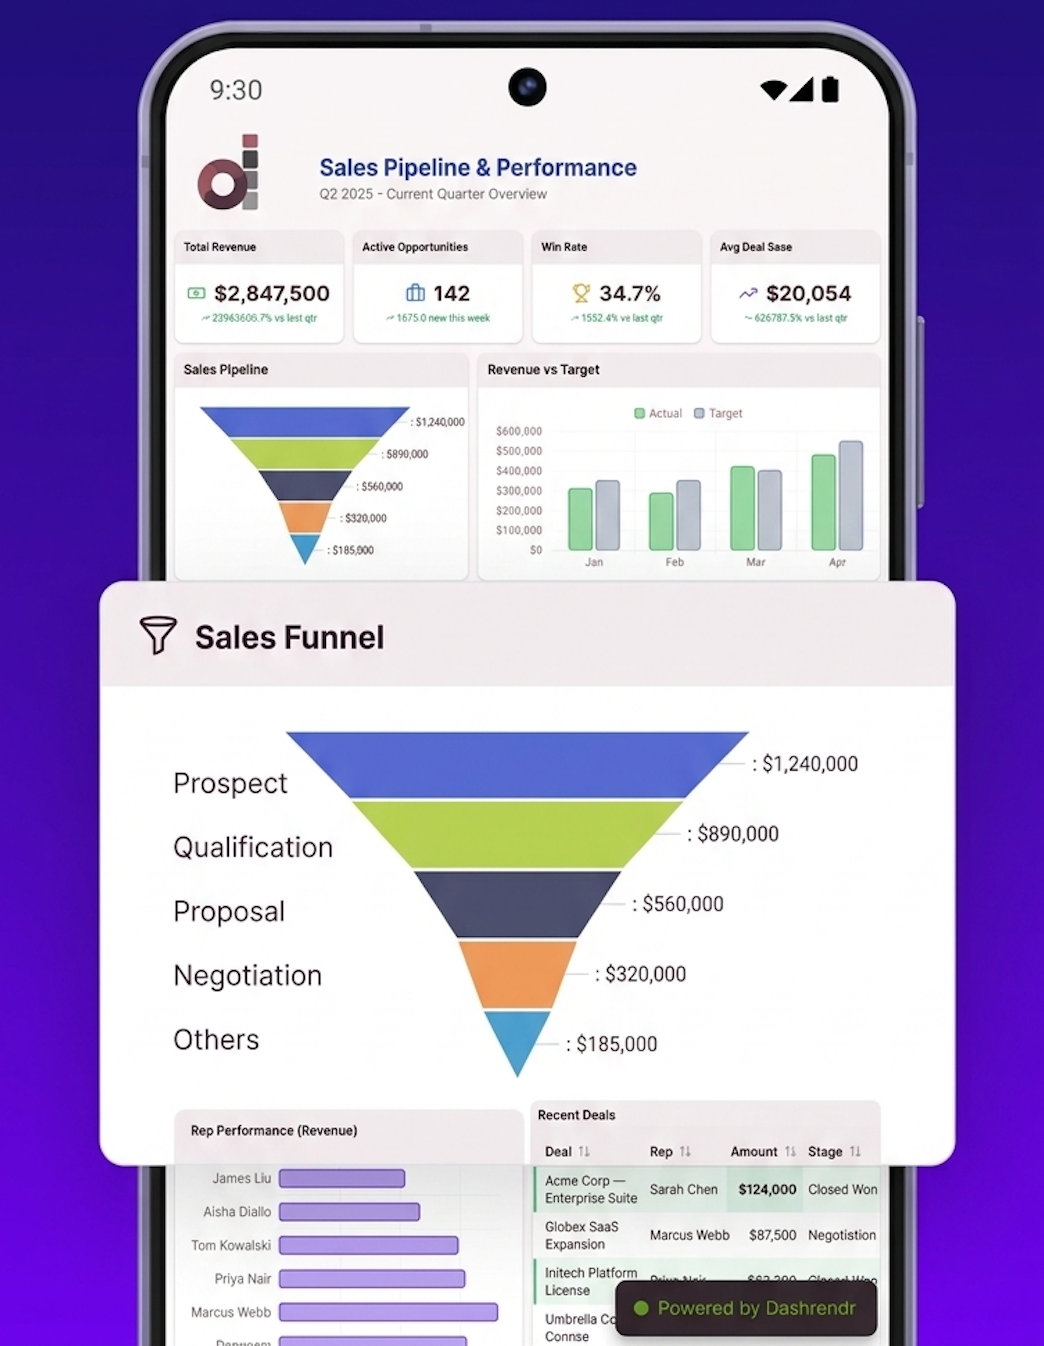
Connect your data
Connect directly to your data sources — Google Analytics, BigQuery, PostgreSQL, Google Sheets and more. Or push pre-aggregated data via REST API. Your database credentials never leave your infrastructure.
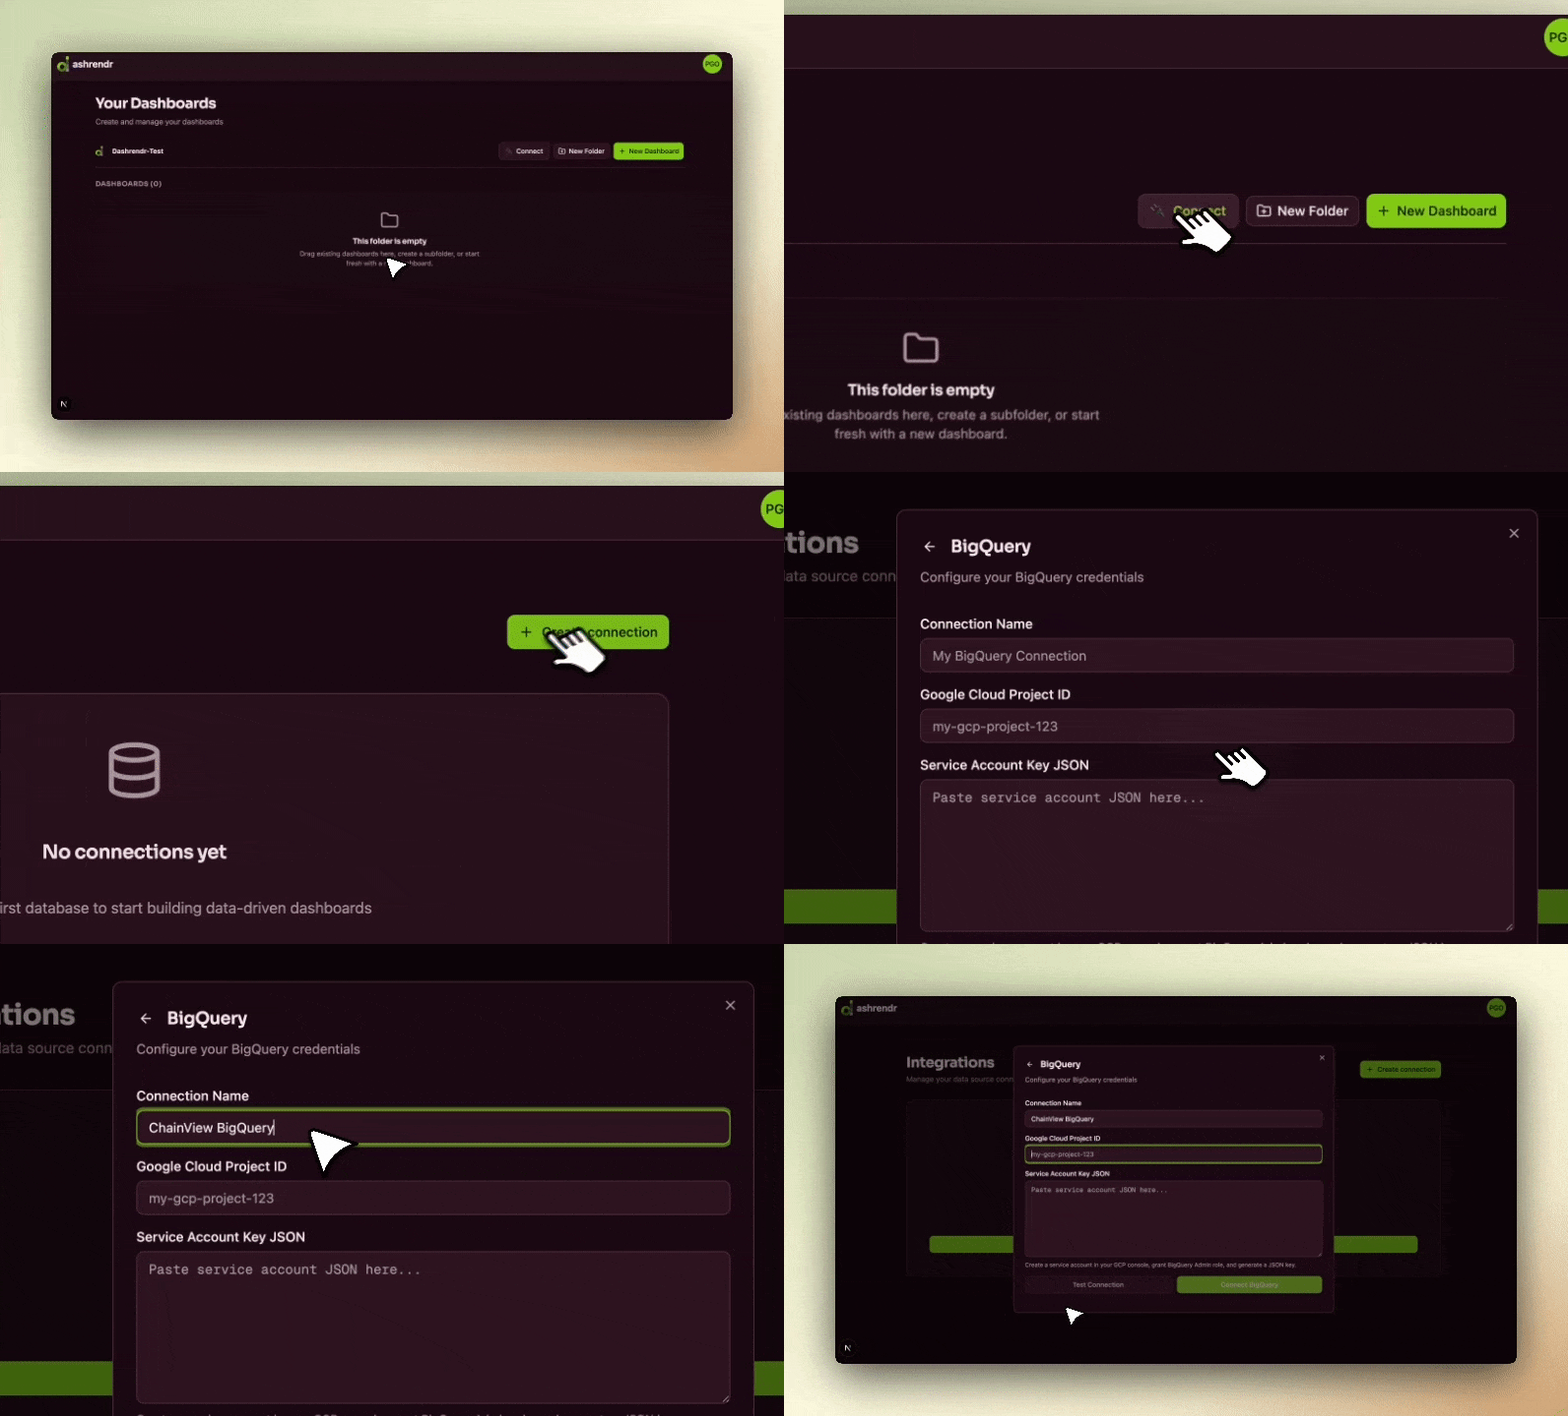
Build your dashboard
Use the drag-and-drop visual editor to build dashboards. Customise colours, themes, and layouts to match your brand. No code required.
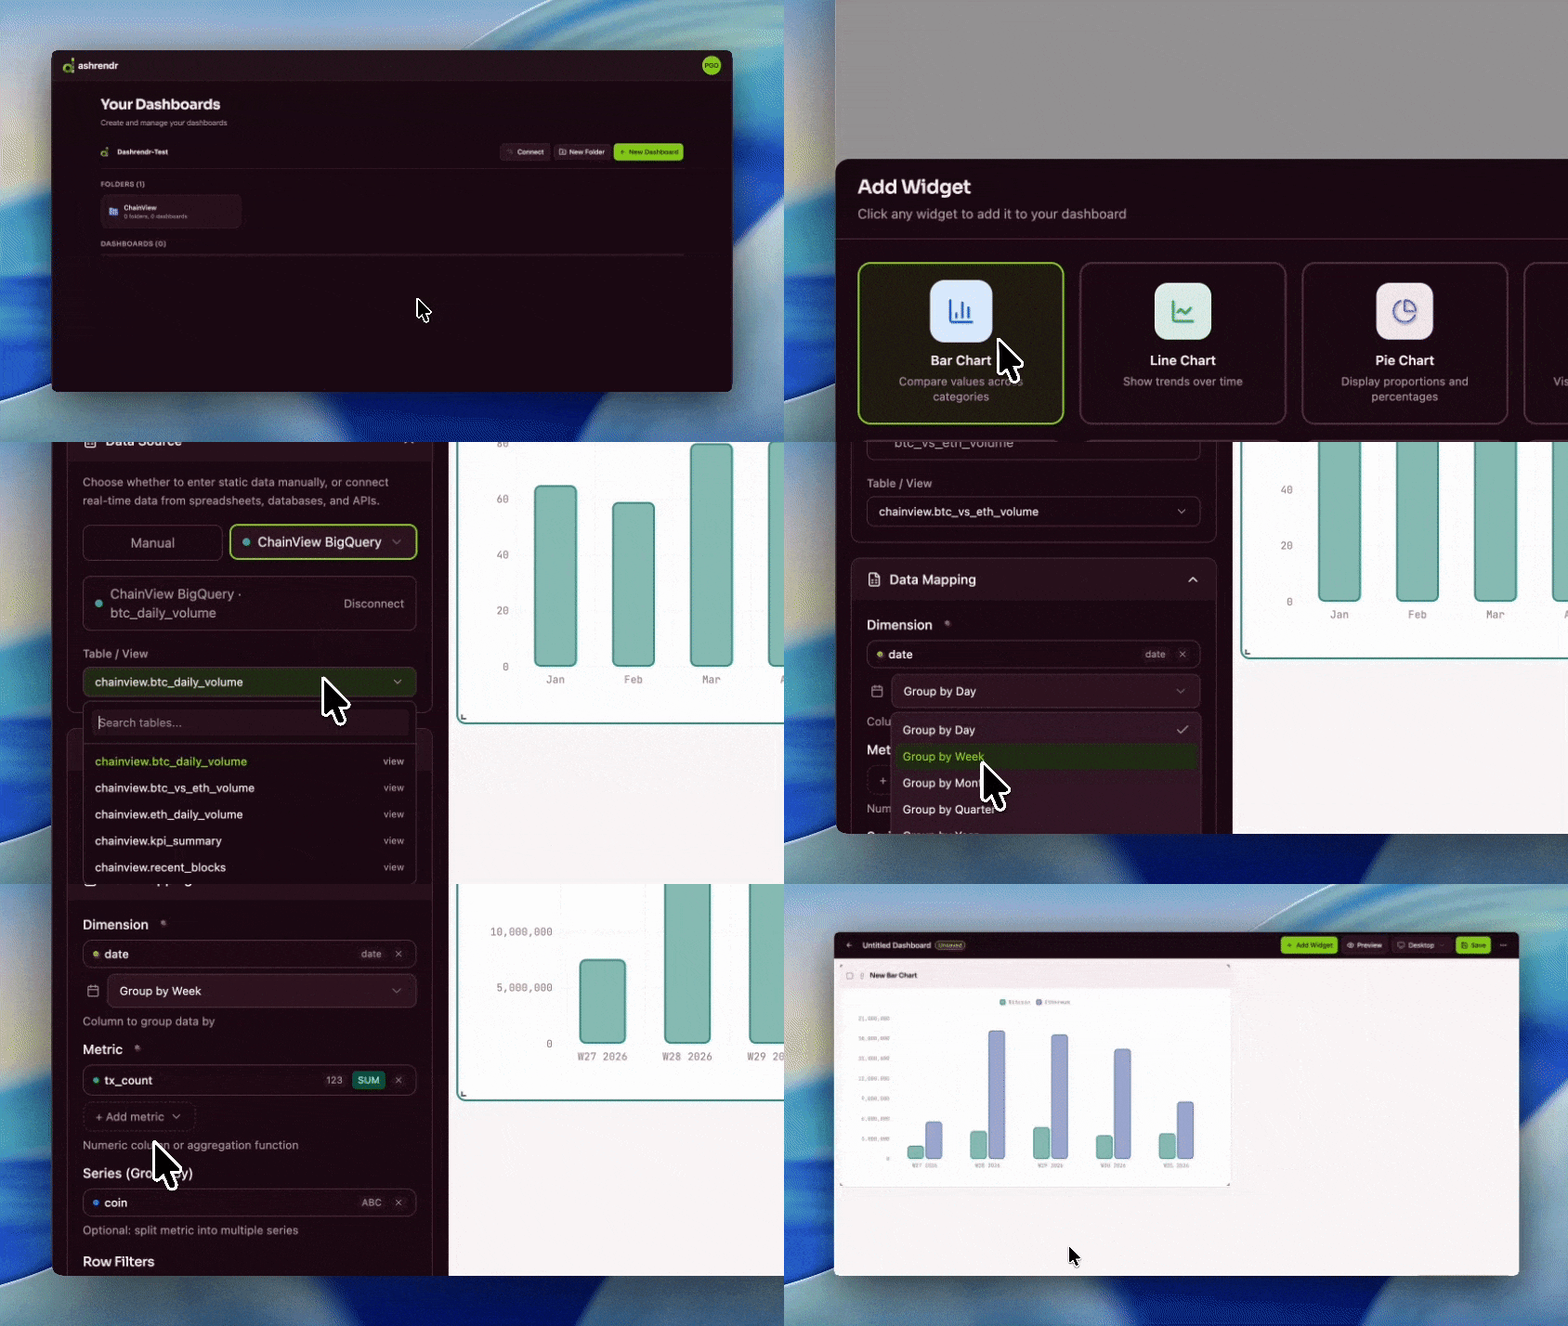
Embed in your app
Copy the embed code and drop it into your application. Works with any stack. Your customers see their data inside your product — not in a separate tool.
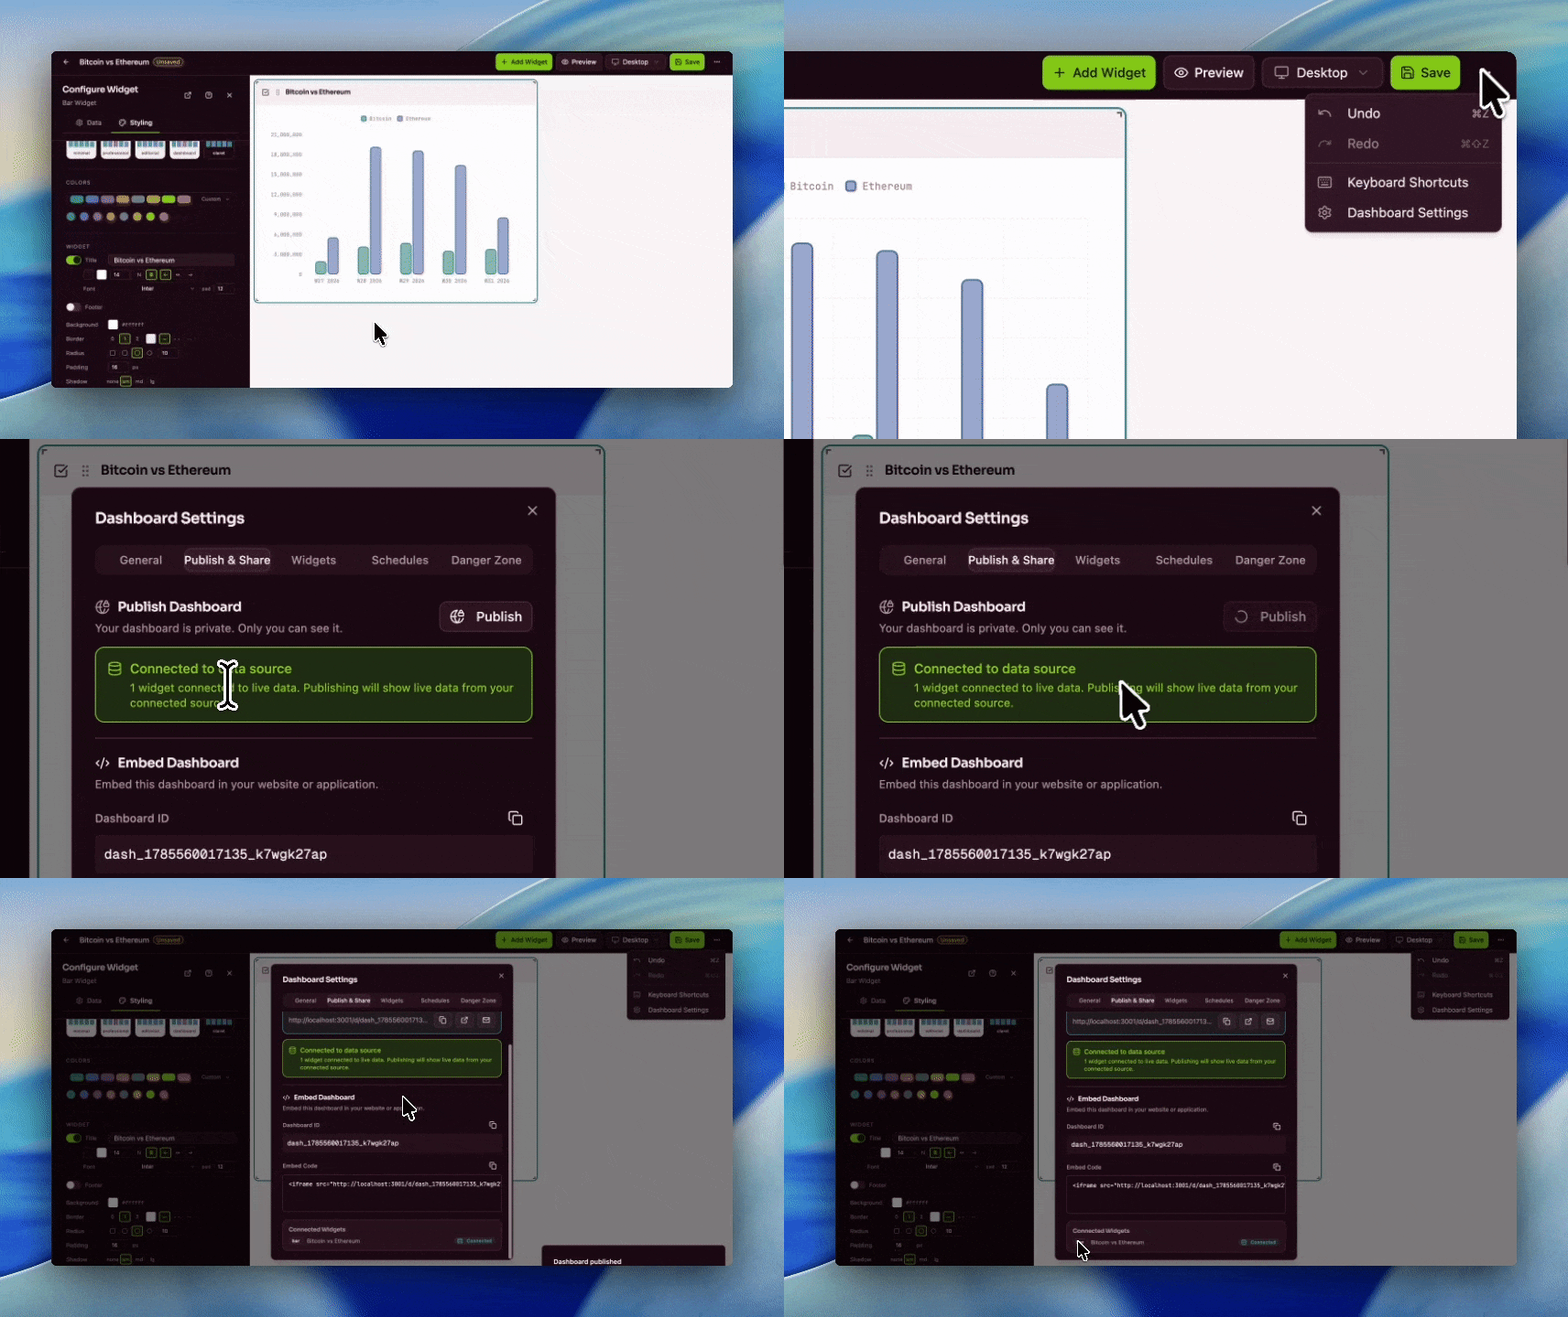
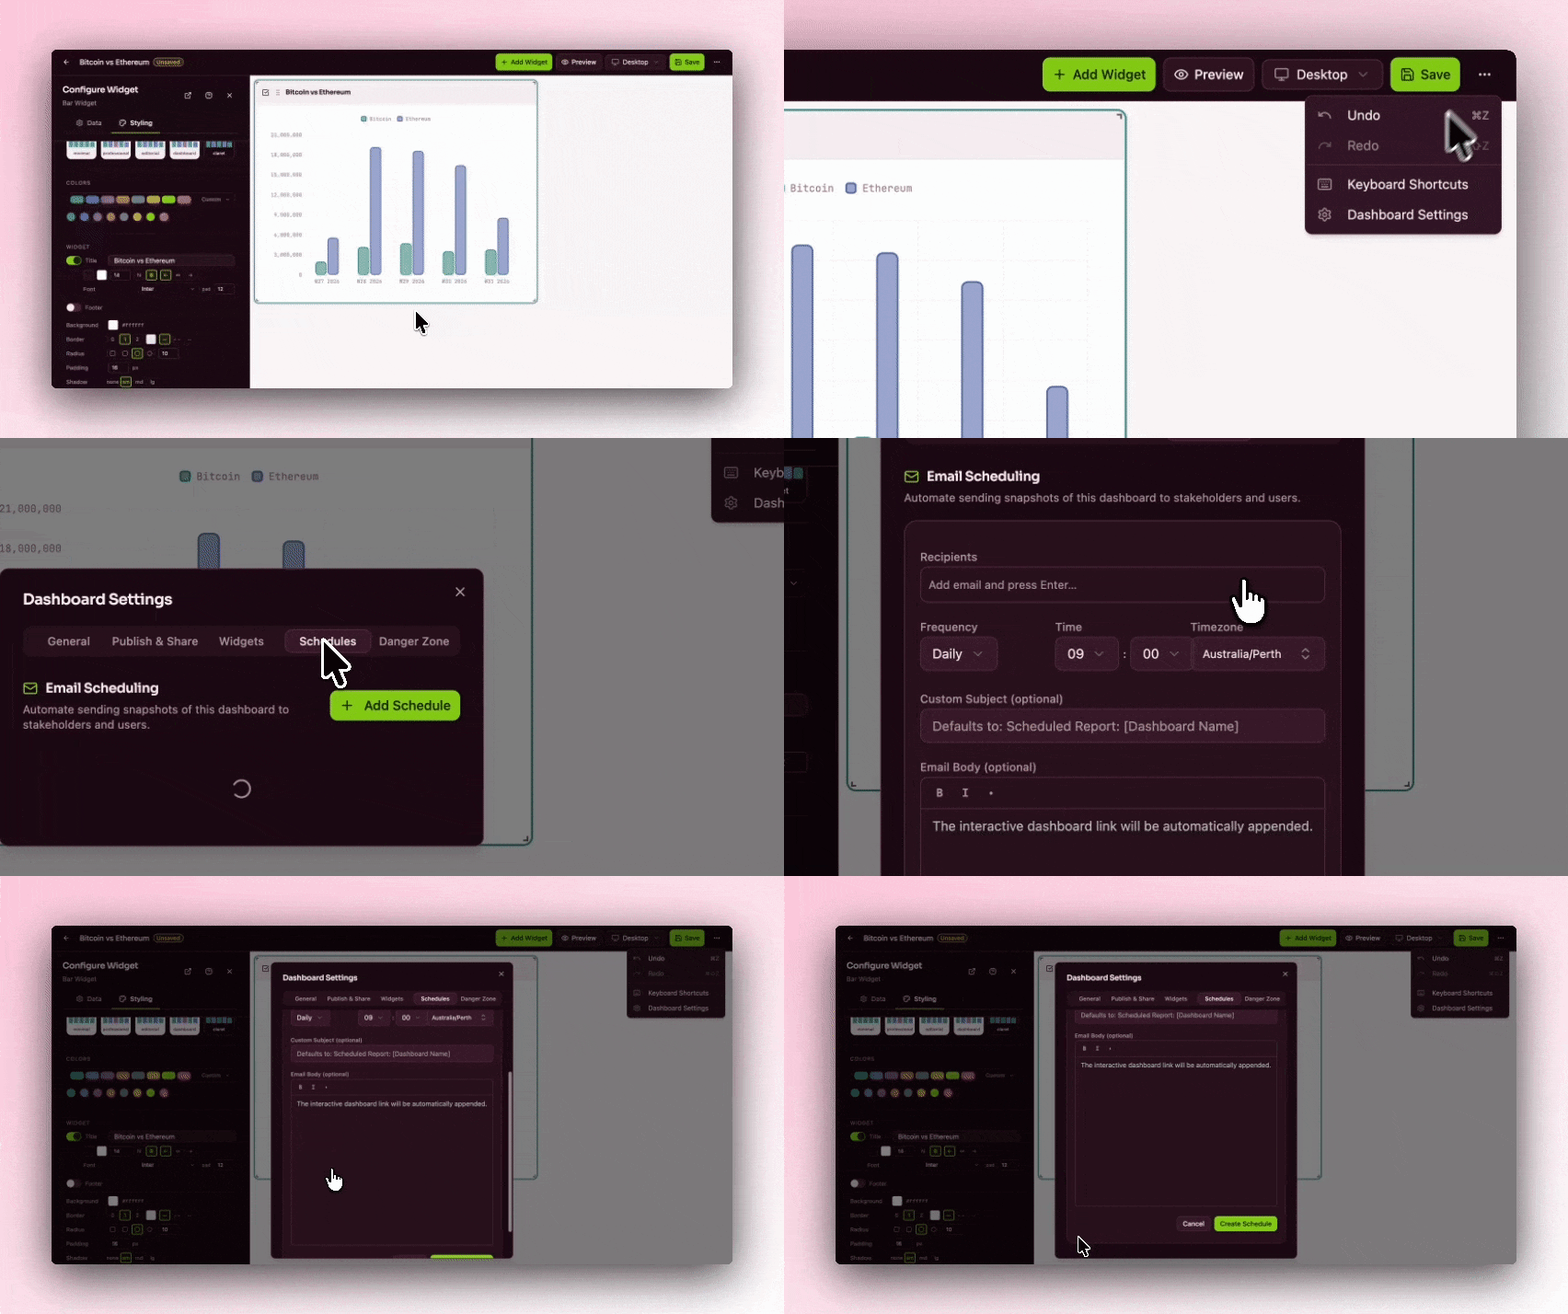
Schedule and deliver
Set a schedule and dashrendr automatically renders your dashboard and sends it by email to your team or your customers. Daily, weekly, monthly — you decide.
Every option has a catch.
You need customer-facing analytics. Here's why the existing options fall short.
Build it yourself
Chart library + layout system + auth + permissions + exports + scheduling. Your team becomes a BI vendor.
Traditional BI tools
Metabase, Tableau, Looker. Powerful tools built for internal analysts — not for embedding into customer-facing products.
Chart libraries
Chart.js, Recharts, ECharts. Great for individual charts. You still build layouts, state, caching, multi-tenancy, and exports yourself.
dashrendr is the missing middle layer.
More powerful than chart libraries. Simpler and cheaper than BI platforms. Connect your data, build once, embed anywhere.
Everything you need to ship analytics.
Built for developers who want to move fast and PMs who need results that look great.
All the charts you actually need
Bar, line, area, scatter, pie, radar, funnel, gauge, heatmap, combo, and maps. Everything configured visually — no code required.
Data connectors built in
Connect to Google Analytics, BigQuery, PostgreSQL, MySQL, MongoDB, Google Sheets, or push your own data via REST API.
Visual drag-and-drop builder
Build dashboards without writing a line of code. Drag widgets onto a grid, configure data, preview in real time.
Fully customisable
Match your brand exactly. Custom colours, themes, fonts, and white-label options so dashboards feel native to your product.
Scheduled email delivery
Automatically render and deliver dashboards by email on a schedule. Daily digests, weekly reports, monthly summaries — set it and forget it.
REST API first
Push pre-aggregated data via REST API. Your database stays private, your business logic stays in your code, your customers see the results.
Simple pricing. No surprises.
Start with a 14-day free trial. No credit card required.
Hobby
For testing and experiments
- All chart types
- 1 dashboard
- 15 widgets per dashboard
Starter
More than competitors at half the price
- 1 owner + 3 team members included
- 15 dashboards
- Unlimited widgets per dashboard
Grow
For production SaaS apps
- 1 owner + 5 team members included
- 50 dashboards
- No watermark
Premium
For teams at scale
- 1 owner + 10 team members included
- Unlimited dashboards
- Priority support
Paloma
Founder & Developer, dashrendr · Perth, Australia
dashrendr was built after years of watching SaaS teams spend weeks on customer-facing dashboards that should have taken days. Chart libraries are too basic. Enterprise BI is too expensive and too complex.
The gap is clear: teams need a way to connect their data, build a polished dashboard, and ship it to customers — without becoming a BI vendor in the process.
dashrendr fills that gap.
The analytics your customers deserve.
Start your free trial today. No credit card required.
14-day free trial · No credit card required · Cancel anytime